Offcanvas

Do you use Data Visualisation?
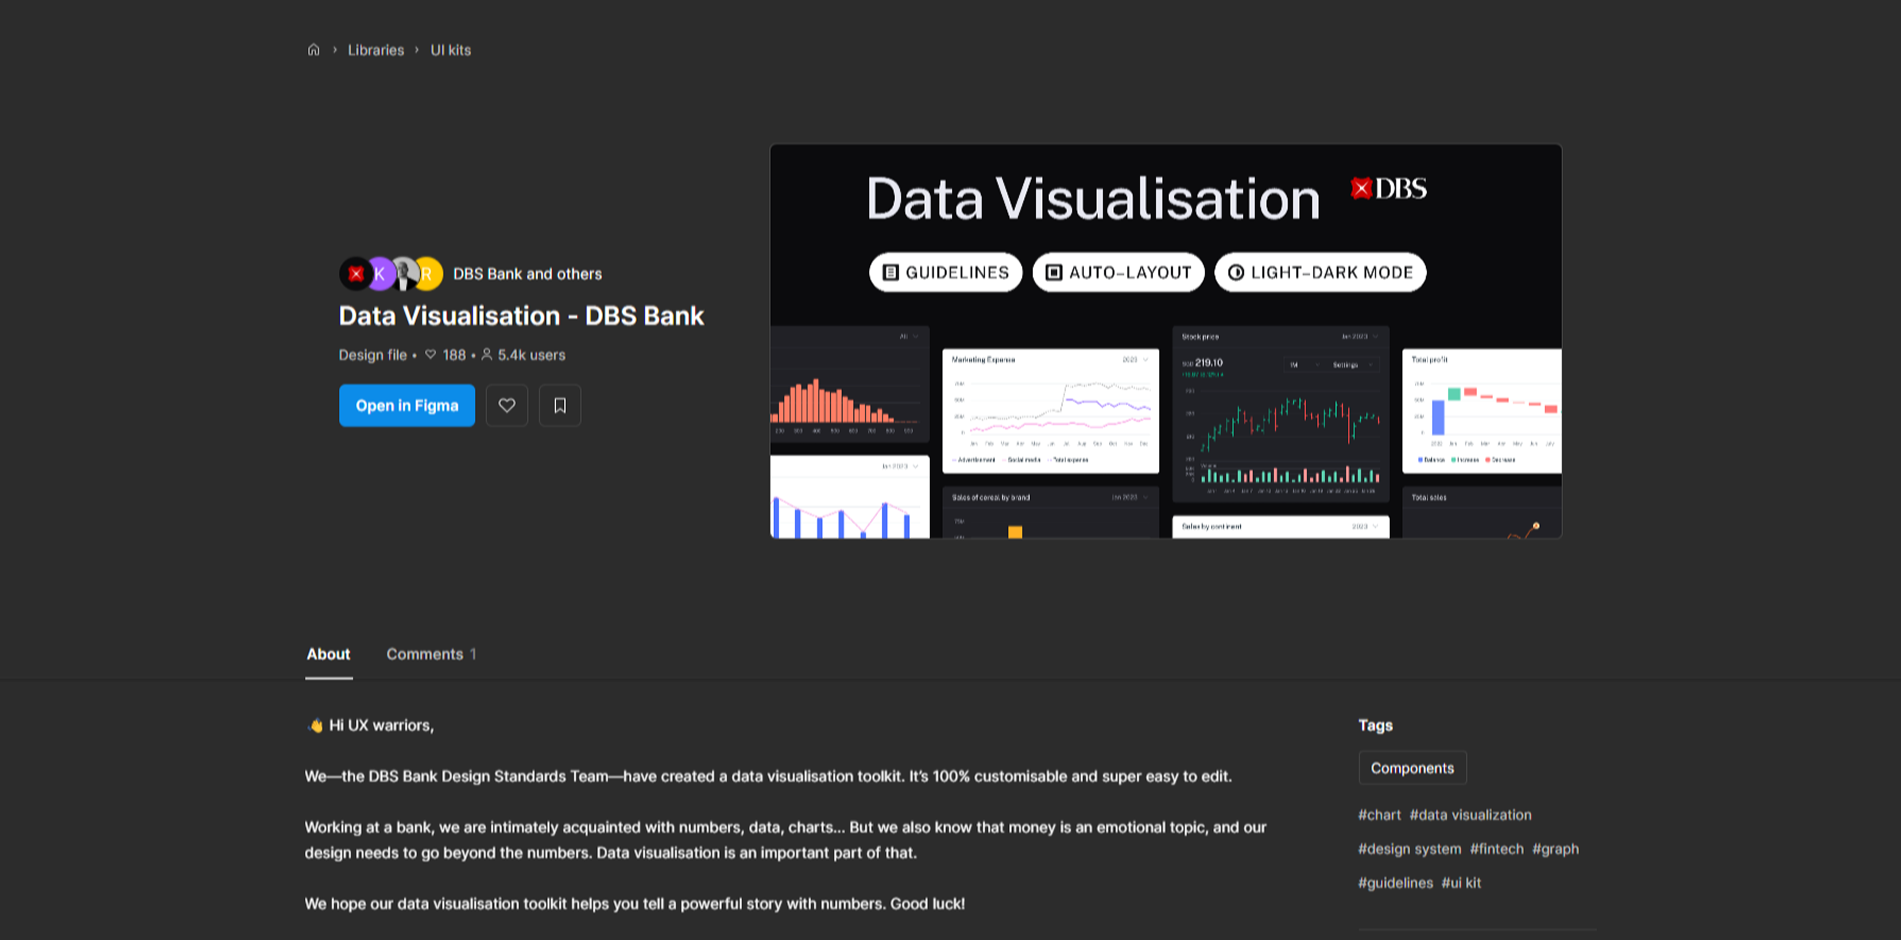
Comprehensive Chart Components: Offers a variety of chart types, including line graphs, bar charts, pie charts, and heat maps, enabling designers to effectively represent diverse datasets.
Customizable Design Elements: Provides editable components, allowing designers to tailor visualizations to align with specific project aesthetics and branding guidelines.
Responsive and Scalable: Ensures that visualizations maintain clarity and functionality across different device sizes and resolutions, enhancing user experience.
Integration with Figma Plugins: Compatible with popular Figma plugins, such as Charts and Chartline, to streamline the process of creating and customizing data visualizations.
Pre-designed Dashboard Templates: Includes ready-to-use dashboard layouts, facilitating quick assembly of data-rich interfaces for various applications.
Regular Updates and Community Support: Maintained by an active community, ensuring up-to-date features and access to shared knowledge and resources.